01Overview
CreditCompass estimates the probability that a loan in a public credit-risk dataset defaults, from eleven applicant and loan features. Next to each estimate it shows the default rate actually observed among held-out applicants who received similar scores, and a sensitivity tool shows how the estimate moves when one input changes.
The model began from a public tutorial notebook. The project was extended with an applied-ML interface, a held-out re-evaluation of the saved model, threshold and calibration analysis, the sensitivity tool, API input validation and this write-up.
02Problem statement
Binary classification with an imbalanced target: 21.6 % of held-out loans defaulted. A model that always predicts “no default” would be about 78 % accurate while catching no defaults at all, so accuracy is the wrong headline metric. The questions that matter are how well the model ranks risky applicants above safe ones (ROC-AUC, and PR-AUC, which focuses on the minority class), whether its probabilities can be taken at face value (calibration, Brier score), and what a chosen cut-off trades off (precision against recall).
03Motivation
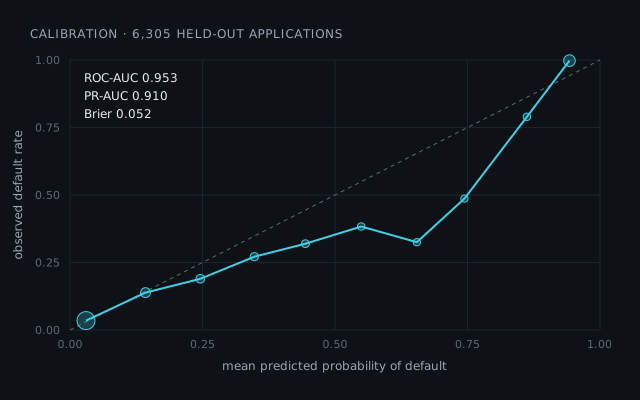
A probability is only useful for decisions if it is calibrated: among applicants scored at 30 %, roughly 30 % should default. The project therefore wraps a strong ranking model (gradient-boosted trees) in an explicit calibration step and reports calibration alongside ranking quality.
04System architecture
- Preprocess — median imputation for numeric features; imputation and one-hot encoding for the four categorical features (scikit-learn
ColumnTransformer). - Model —
XGBClassifierwith class weighting, tuned by randomized search (150 candidates × 5 folds, scored by average precision). - Calibrate —
CalibratedClassifierCV, sigmoid method, 5 folds. - Decide — the API returns the probability, a stored threshold (0.695) and a “High/Low Risk” label.
- Serve — FastAPI with validated inputs; the interface adds the observed-rate context and the sensitivity tool.
05Technical implementation
- The evaluation script reproduces the notebook’s cleaning and stratified 80/20 split (
random_state = 42) and scores the saved pipeline exactly as the API does — nothing is retrained. - The API rejects impossible inputs with HTTP 422 (unknown categories, non-positive income or amount, age outside 18–100, employment length longer than age), while still accepting unusual but possible values with an extrapolation warning in the interface. All 5,715 complete held-out rows pass through the API with probabilities identical to the model’s direct output.
- The sensitivity tool varies one feature across its training range, calling the real API at each point.
06Dataset and preparation
A public credit-risk dataset of 32,581 loans. Its origin, period and currency are undocumented, so it is not redistributed with the project.
- Cleaning: duplicates removed; age limited to 18–100; employment length at most the applicant’s age and at most 60 years (rows with missing employment length are dropped by this filter); loan amount positive → 31,522 rows.
- Split: stratified 80/20 → 25,217 training and 6,305 test applications (1,362 defaults).
- Missing values: 3,116 missing interest rates are median-imputed inside the pipeline.
- Features (11): age, income, home ownership, employment length, loan purpose, loan grade, loan amount, interest rate, loan-to-income ratio, previous default on file, credit-history length.
07Model design
Gradient-boosted trees handle mixed numeric and categorical features and non-linear interactions without scaling. In the notebook’s 5-fold cross-validation on the training data, an untuned XGBoost reached ROC-AUC 0.939 against 0.871 for a class-balanced logistic regression, which motivated tuning XGBoost further. Sigmoid calibration was added because boosted trees’ raw scores are not reliable probabilities.
08Evaluation methodology
- Threshold-free ranking: ROC-AUC and PR-AUC.
- Probability quality: Brier score (compared with always predicting the training default rate) and a 10-bin calibration curve.
- Decision trade-offs: precision, recall and confusion matrices at the stored threshold, at 0.5, and across a threshold sweep.
- Feature reliance: permutation importance (drop in ROC-AUC, 5 repeats).
09Verified results
| ROC-AUC | 0.953 |
|---|---|
| PR-AUC (average precision) | 0.910 |
| Brier score | 0.052 |
| Brier score, always predicting the base rate | 0.169 |
| Threshold | Precision | Recall | F1 | Flagged | Missed defaults |
|---|---|---|---|---|---|
| 0.695 (stored) | 0.967 | 0.742 | 0.840 | 16.6 % | 351 |
| 0.50 | 0.915 | 0.767 | 0.834 | 18.1 % | 318 |
| Model | CV ROC-AUC | Source |
|---|---|---|
| Logistic regression (class-balanced) | 0.871 | notebook |
| XGBoost, untuned | 0.939 | notebook |
What the model relies on
Permutation importance (drop in ROC-AUC): income 0.102, home ownership 0.095, loan-to-income ratio 0.089, loan grade 0.040, loan purpose 0.035, interest rate 0.024; the remaining features each contribute less than 0.01.
Calibration is good at low scores — among the 4,290 applications scored below 10 %, 3.5 % defaulted — but mid-range scores (about 0.4–0.75) overstate the observed default rate.
10Demonstration video
Recorded on the live deployment, 11 October 2026; no audio. A typical application scores 3.5 % (low risk); a grade-G application with a higher rate and amount scores 94.8 %; an age of 500 is rejected; the sensitivity tool shows the typical applicant’s estimate rising from about 3 % to 17 % across interest rates; then the held-out evaluation.
11Deployment and source code
- Live demo: anshaiml369.github.io/creditcompass — Hugging Face Space (Docker, Python 3.12, 2 vCPU, 16 GB). On the earlier Render deployment, on 200 held-out applications the live service matched the local model to within 0.000000001 (floating-point differences only).
- Source code: available on request; the dataset is not redistributed.
12Limitations and known failure modes
- Threshold chosen on the test split. The notebook also computed 2·(P − R)/(P + R) instead of F1 when searching for it; the stored 0.695 is nonetheless close to the best F1 on a 0.05 grid (0.65).
- Lender-assigned inputs. Loan grade and interest rate already encode the lender’s own risk assessment, so part of the model’s accuracy is inherited from it.
- Fairness not assessed. Age is an input, and no disparate-impact or group-wise error analysis has been done.
- One dataset of unknown provenance, with no temporal or external validation.
- Mid-range probabilities are over-confident; the hyperparameter search was not seeded, so it cannot be reproduced exactly.
13Future improvements
- Choose the threshold on a validation split with an explicit cost of missed defaults versus false alarms.
- Error rates by age group, and an ablation without lender-assigned features.
- Isotonic calibration and a seeded, reproducible search.